I hope you have heard the exciting news about our recent launch of the Infinity detectors. They are the new generation of Ultim EDS and Ultim Extreme windowless detectors. We are still keeping many of the flagship performance characteristics of Ultim detectors but with introduction of some new capabilities. If you are interested to know more, of course please check the rest of the blog, but I would also encourage you to sign up for our webinar Unlock the Infinite potential of EDS learn what is now possible with Infinity detectors from Oxford Instruments - Nanoanalysis - Oxford Instruments broadcasting on 12th of December.
We have made some significant improvements with Infinity generation of EDS detectors due to ever increasing demands for better micro- and nano-analysis. Now more than ever boundaries of what is required of EDS are being pushed. Our users tell us they want analyse smaller features and more complex structures, measure lower concentrations, or just to perform routine analyses faster and more easily. I imagine that you could recognise yourself in at least one of those requirements. We all want more and certainly you can always find many options in the market promising exactly the same things.
The question is, will the data you are collecting be reliable, is it the type of data that is most suitable for you and is it reflecting the true nature of your samples. I think, here at Oxford Instruments, we have always strived to achieve exactly that, the ultimate truth. I know I am perhaps being a bit dramatic or trying to sound poetic =). But when you think about it, it makes sense, if we are trying to develop our technology with the intention that it should provide you the most accurate interpretation of the material, I think there isn’t a better approach than this.
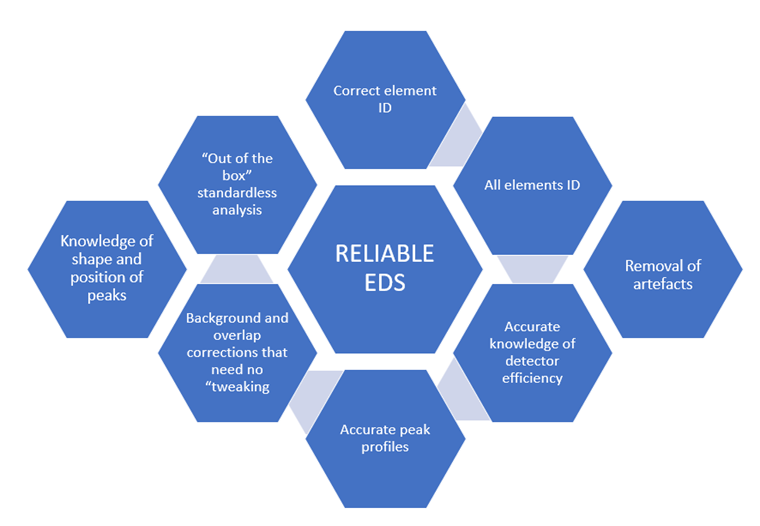
This has me thinking how would I explain it in a nice simple way; what are some of the new improvements with Infinity detectors? And then I thought, what if I start with everything that you have to consider in order to avoid bad results? From the graphic in Figure1, you will see how the whole EDS eco system is quite complex, and what I want to point out is if any of the things mentioned in the boxes are not working correctly, it could lead to bad or wrong results.
EDS eco system

Figure 1: The EDS eco system - all the components of the EDS technology that have to work perfectly to provide excellent results
With the Infinity range, we have continued to tackle these building block to see what can be done to achieve even better results.
Knowledge of shape and position of peaks, accurate peak profiles
We have now introduced Tru-Q® IQ spectrum processing; that is individual detector performance characterisation and optimisation. It means we can guarantee that for each individual detector we characterise the exact shape and position of all X-ray peaks, even unavoidable physical effects like incomplete charge collection, that affect low energy peaks, is accounted for. So, every detector we ship is ideal and achieves the best performance possible.
Overlap correction
We can now deconvolute even harder overlaps thanks to our improved low energy resolution which is now C Kα ≤ 46 eV @ 50,000 cps, 20% better than our previous generation, for where peaks are closest together and most likely to be overlapped. This is in addition to our new individual detector optimization to ensure the best deconvolution results are achieved.
Removal of artefacts
New pulse pile-up solutions, through improved signal processing and spectrum correction algorithms allow us to achieve faster and more accurate characterisation of microstructures. I’ve not gone into to great detail here to explain all these improvements, and you may ask why is that important, or why should I care?
I will answer this very briefly. If you falsely ID elements in your spectrum (for example because of non-ideal peak shape), you will have “qualitative” errors. Alternatively, if you incorrectly measure peak intensities (because of inefficient pulse pile up correction) you will have a “quantitative” error. For this reason, you need the best technology to eliminate all these potential errors.
Results validation
Now I am coming to the part that is important for our users. You could ask yourself are my results valid, is that information truly displaying the true nature of the materials I am analysing.
One easy way to answer this is to check the quality of the results compared to some standard materials. With a standard of known composition, we can check for accuracy and investigate, for example, how high count rate affects Auto-ID and quantification. When working at high count rate, the signal processing cannot always cope with the amount of signal; two X-rays arriving at the sensor close together can be interpreted as a single event and combined into single peak in the spectrum, an effect called pulse pile-up. As Simon explained in his recent webinar (Modern SEM-EDS Systems Explained – What is cutting edge technology today? - Nanoanalysis - Oxford Instruments), pile-up is actually what limits our ability to go faster and faster. At some point you stop gaining useful peak information but just increase the counts in spectrum by getting more pile-up signal and noise rather than more useful counts.
New signal processing with Infinity significantly reduces pile-up, but even so, pile-up correction remains an important piece of spectrum processing. It will have a big influence on peak intensities and consequently X-ray mapping and quantification. One of the benefits of our pulse pile-up correction is that it not only removes the pile-up, it puts the counts back to where they belong. This means the number of X rays will increase, the peak count rate will increase, and so the counts from sum peaks are put back to parents’ peaks and the count rate increases. The increase is different for different peaks because of the complexity of the pulse pile-up, as you can see in Figure 2. In this spectrum, we can see the difference between when we have correction on and off, and peak intensity varies from being reduced by the correction by15% (Fe) to an increase in 28% (K).

Figure 2. Spectrum without pile-up correction displayed in green, spectra after pile-up correction displayed in yellow
How can we check if this part of the technology is working properly? Well by comparing results against standard data. We can see a strong agreement between the values of our measurement to the standard values in Table 1. We can trust this result because the wt total is close to 100%, and the ratio between elements is correct and compares well to standard data. So even at maximum throughput, quantitative data is reliable. This leads me to conclude that the spectral processing is correct, and I can trust the results I will achieve even when I am working at maximum speed. The first time when I tried quantification at this speed, I wasn’t even sure that it waspossible. I was just so used to acquiring data slowly if I want to quantify materials, that I wouldn’t even have consider count rates like this for quantification.
This brings me to something that is important to highlight and something we can all be guilty of. We like protocols and certainty, but as technology is evolving, we can change how we do things to take full advantage, and make things easier for ourselves. In this case, I no longer have to collect spectra for a minute at low count rate if I want to quantify it. I can now get the same quality of result in seconds. This translates over to mapping as well! I don’t need to collect maps for 10 or 15 minutes, as I can do it in 30 seconds and data is still reliable. That is the whole beauty of the progress in EDS technology; we can do so much more.

Table 1. Orthoclase analysis at 1 million counts
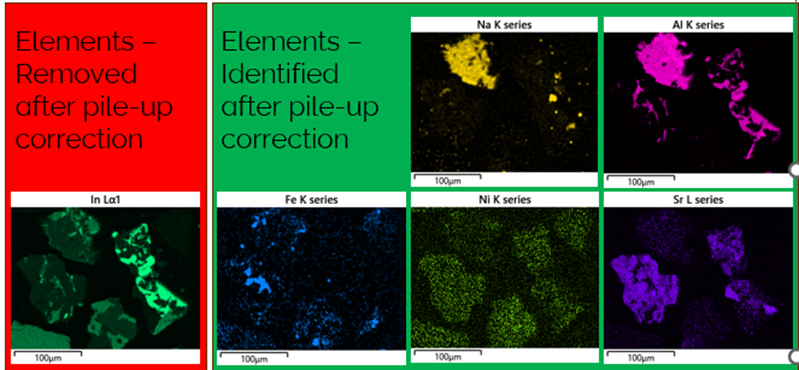
For example, if I want to quickly analyse some mineral samples, I know that I can trust the data in the X-ray maps as well, because each pixel is processed the same way as with the quantification of spectra. In the example in Figure 3, turning on the pile-up correction removes artefacts elements like In and allows previously hidden elements, like Na, Al, Fe, Ni, Sr, to be added even after an extra-quick acquisition of less than a minute.

Figure 3: high speed mapping of mineral sample with the unique new processing to suppress and correct for pile-up, for accurate automatic display of maps from only real elements
Consistent results across the whole range of conditions and tasks
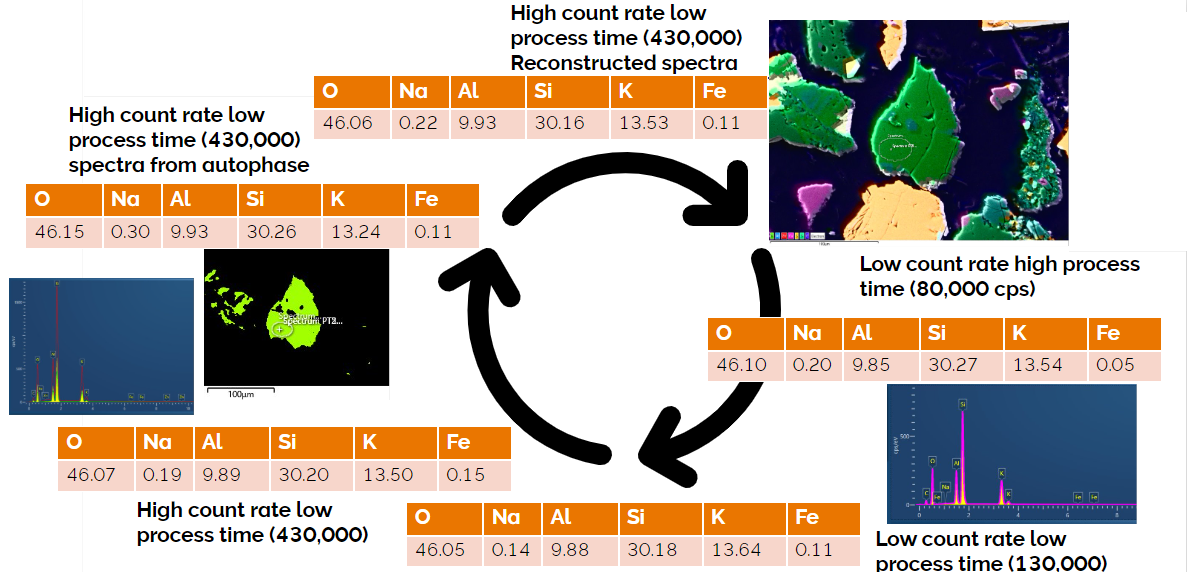
This brings me to my last point, how we can trust data from every step of the acquisition. A few days ago, I was on the microscope with a colleague collecting some data, and we were honestly amazed how the results we obtained were so reliable almost no matter what we were doing. We started with Live Chemical Imaging to find orthoclase grains. Then we collected some low count rate, long process time spectra, and unsurprisingly the quant was great. Then we tried to collect some data with low count rate and short process time - still no problem. We switched over to high count rate, still the results were great. Then we started quickly mapping the grain with high throughput, used the AutoPhaseMap function to segment the map into phases automatically and checked the composition calculated by the spectrum from that orthoclase phase. Lastly, we constructed spectra from the map of that phase (Figure 4). And yes, all the results were reliable and consistent. I felt truly happy and accomplished being able to confirm that all the hard work everyone has put into development these new Infinity EDS detectors can truly give you more.
I hope this story will spark your interest and that it also shows why all EDS detectors are not the same and why you should strive to achieve the best performance. Hopefully you will join us for the upcoming webinar to learn more about Infinity detectors!

Figure 4. Reliability of EDS data thought the measurement cycle or set of conditions


