A touch of history
We’ve come a long way since the invention of the first battery (the ‘voltaic pile’) back in 1800 by Alessandro Volta in whose honour the National Battery Day is celebrated on 18th February (Alessandro Volta’s birthday). The battery that Volta is credited with inventing was made of zinc and copper (electrodes), while sulphuric acid mixed with water or saltwater brine was used as electrolyte. The differentiating characteristic of this early electrochemical cell was that it could provide a steady electrical current.
Battery technologies
Nowadays, the most prevalent battery technology is that of Li-ion batteries due to the outstanding energy and power density it offers in relation to demanding applications such as electromobility. However, there are other battery technologies suitable for less challenging applications, such as Na-ion battery technology for stationary energy storage (grid stability). Alternative technologies are being developed and investigated (Al-ion, Mg-ion, Al air, Zn air, all solid state, etc) due to potential shortage of raw materials in the future.
Despite the leap in science and technology that allowed for the development and commercialisation of Li-ion batteries (Chemistry Nobel Prize in 2019), we still have a long way to go. We need batteries to be safe, reliable, and durable. In order to design batteries that fulfill these prerequisites, we need to understand the properties of the different materials used for each of the battery components.
In this blog post, we briefly explore how cathode and anode materials can be analysed with SEM-EDS. Also, we touch on other SEM-based techniques applied during the process of the cathode precursor powder particles becoming (positive) electrodes.
Why is QA/QC essential for battery materials?
Quality control (Figure 1) is very important to find contaminating (Figure 2) particles in battery powders early. These particles can pierce through the different components of the battery and cause short circuits and detecting them provides significant benefits:
- The immediate, short-term benefit is that expensive raw material (because of its high purity) is less likely to be wasted as the contamination sources can be identified and eliminated, leading thus to improved standard operating procedures (SOPs);
- A more long-term benefit is that batteries themselves (as a finished product) will be less likely to malfunction (ranging from catching fire, exploding, or failing prematurely.
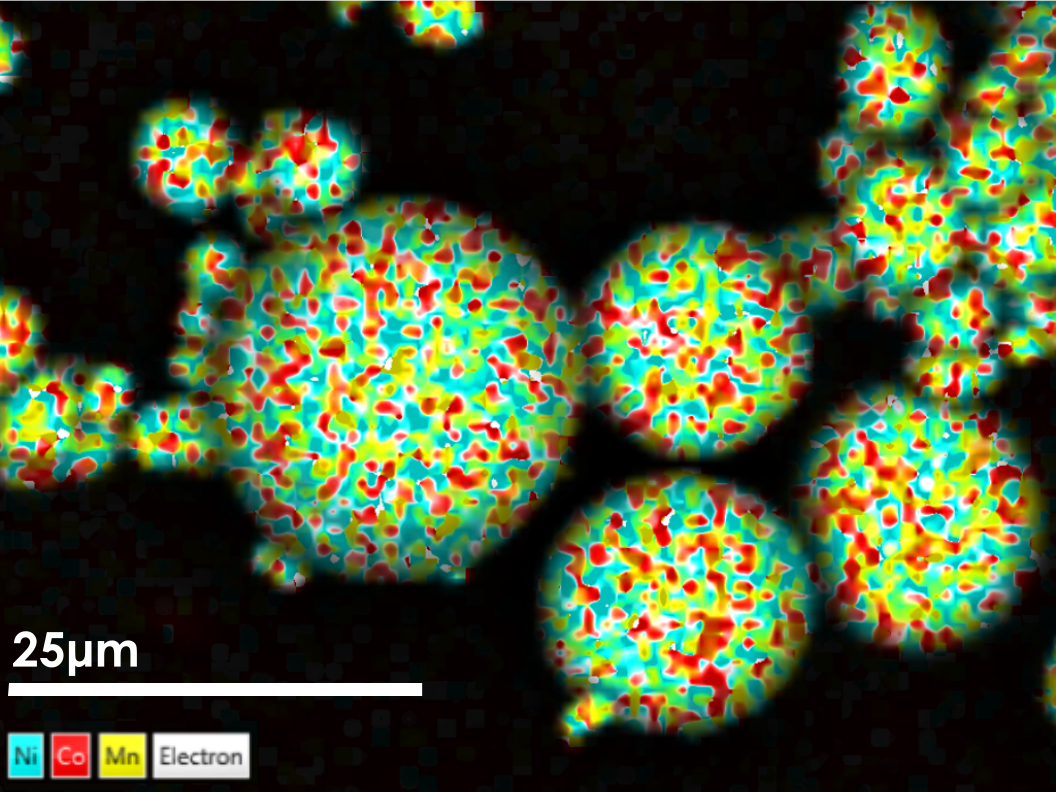
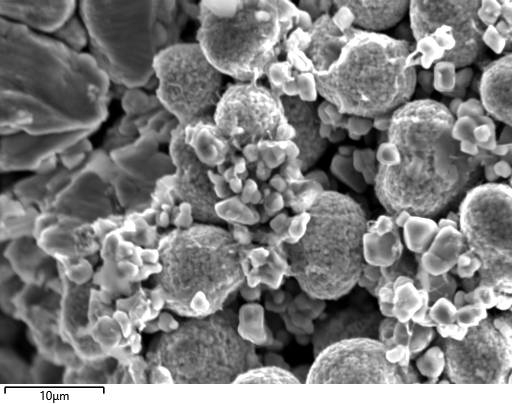
Figure 1 QA/QC of cathode precursor battery powder (NCM811) with EDS (Ultim Max).
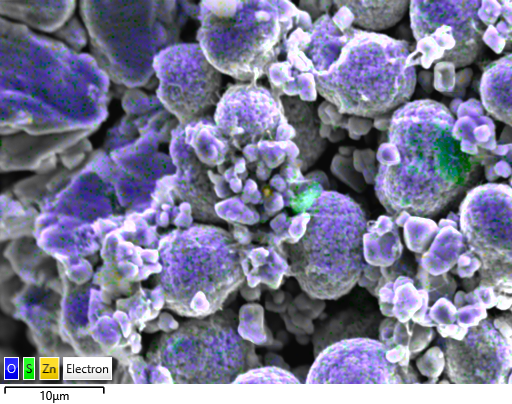
Figure 2 ZnS contamination (in green) in NCM811 cathode precursor particles.
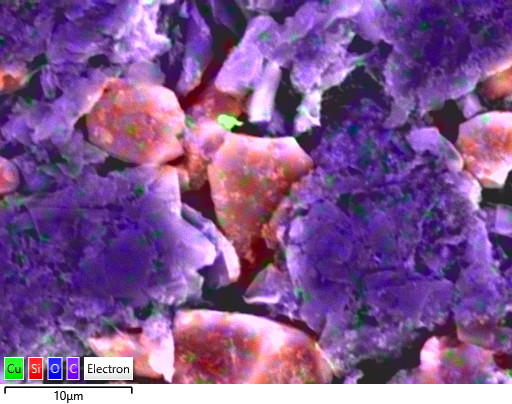
Quality control of raw materials is a routine manufacturing process for cathodes. However, it is also important for anodes. In Figure 3, Ti contamination, and in Figure 4 Cu contamination have been detected in the SiC anode. Contaminants can find their way into the electrodes at any point in the manufacturing process. There might be contamination present that is more difficult to detect, where it came from stressing how important quality control and formulation testing are at various production stages.
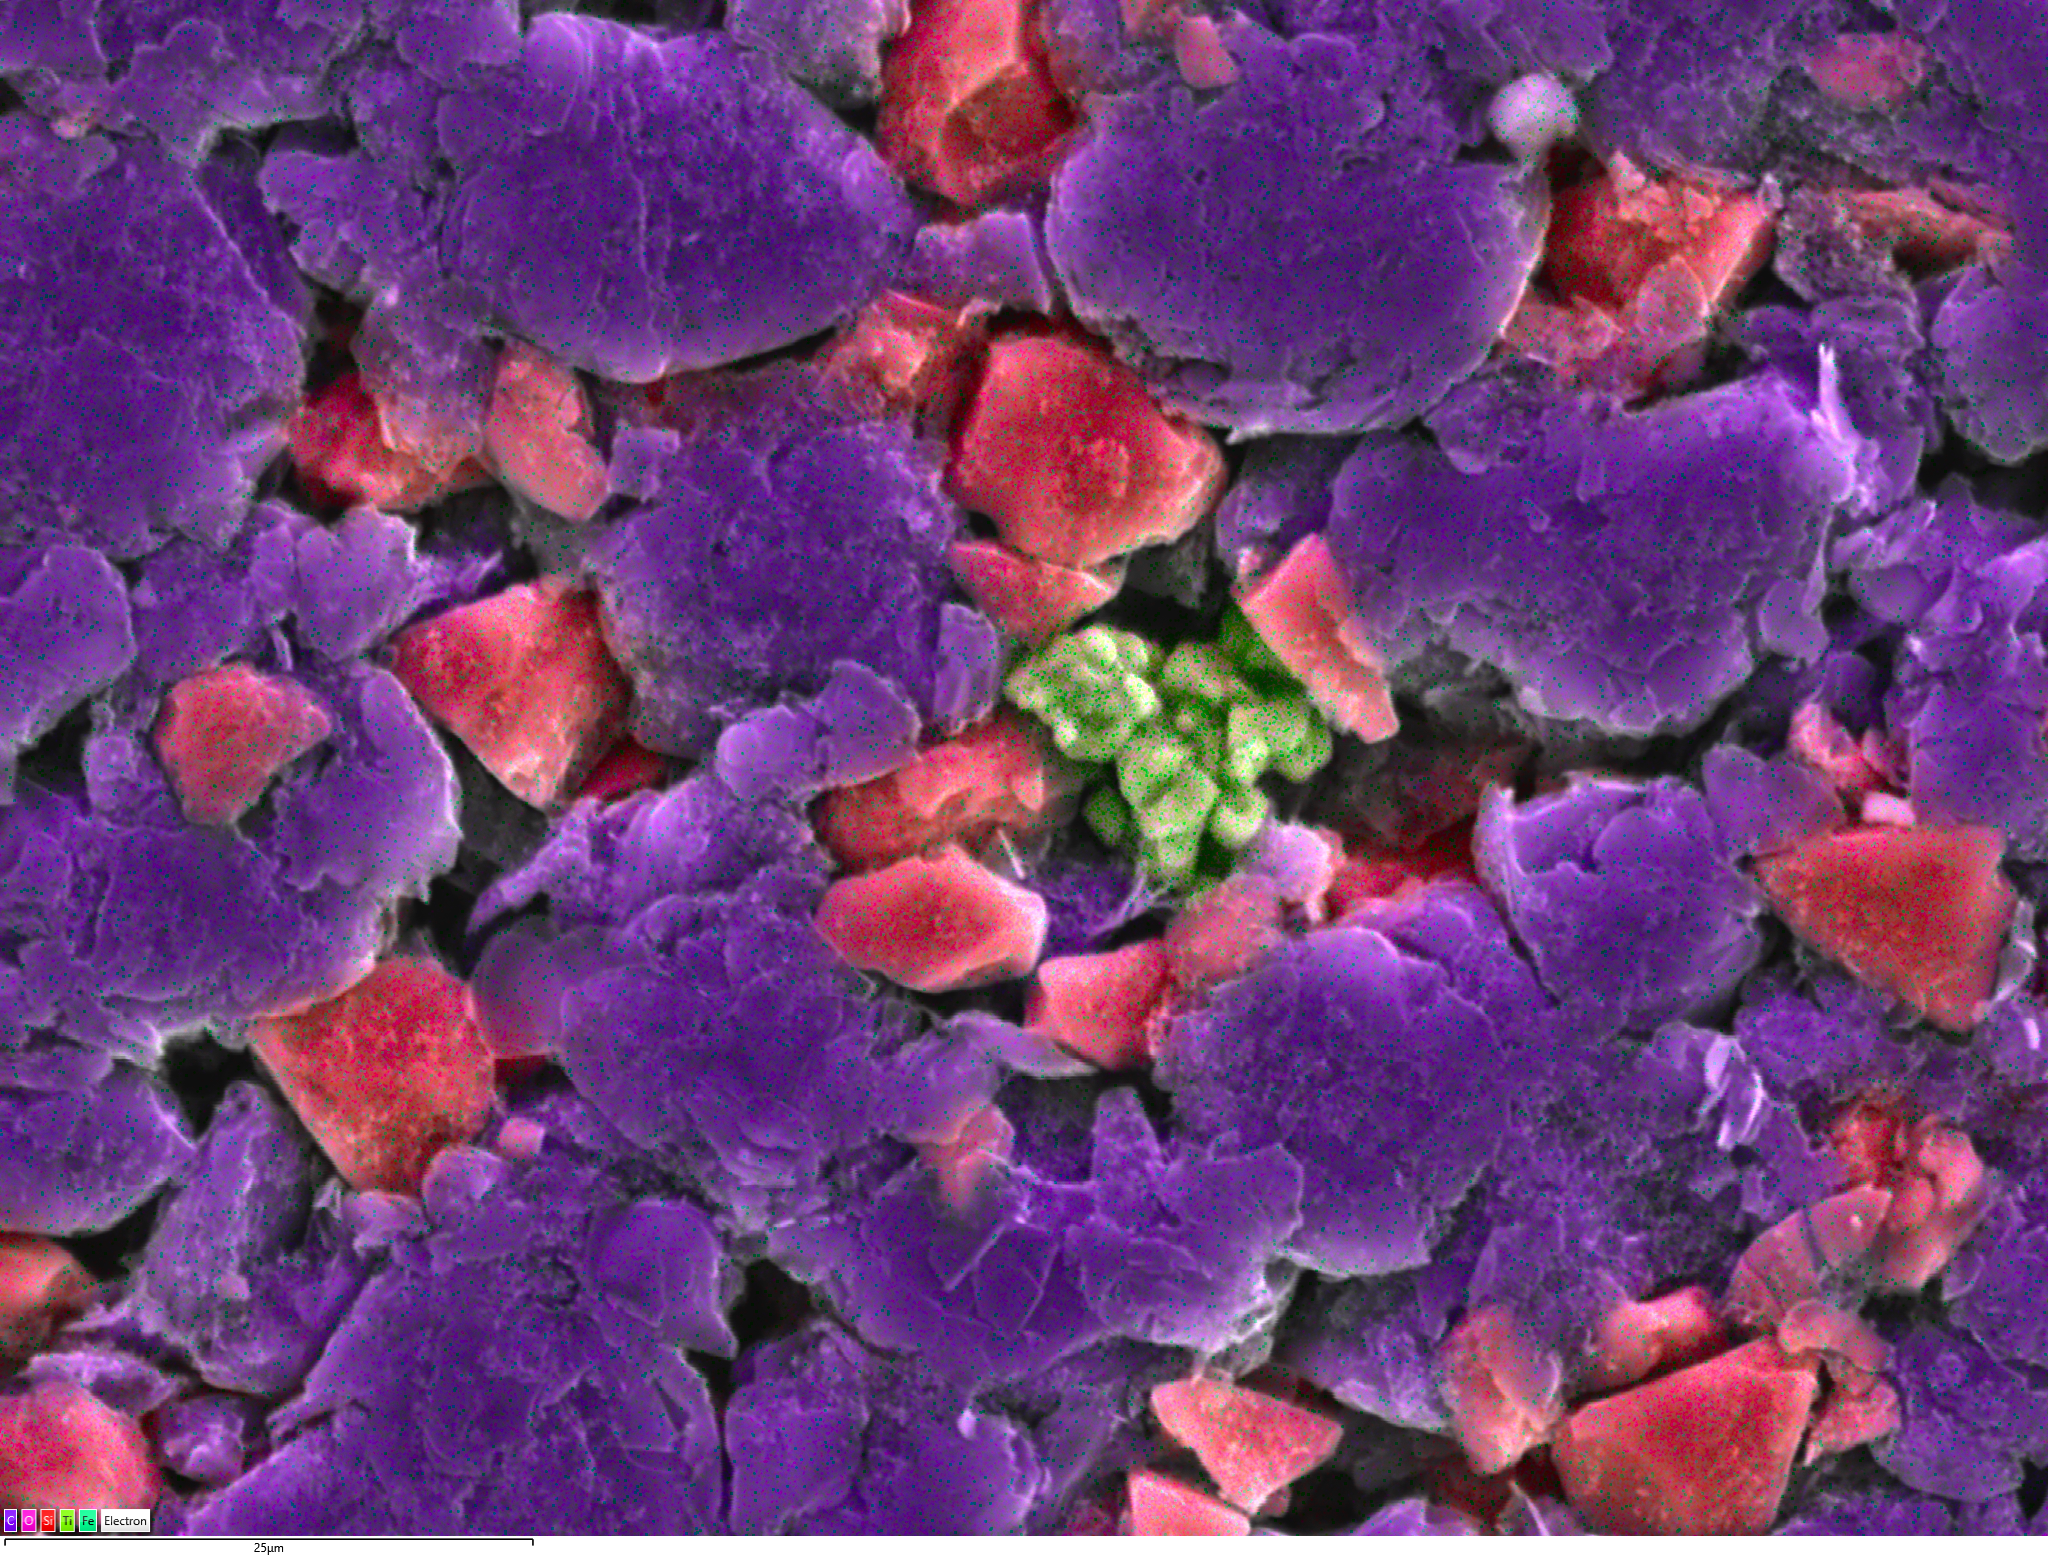
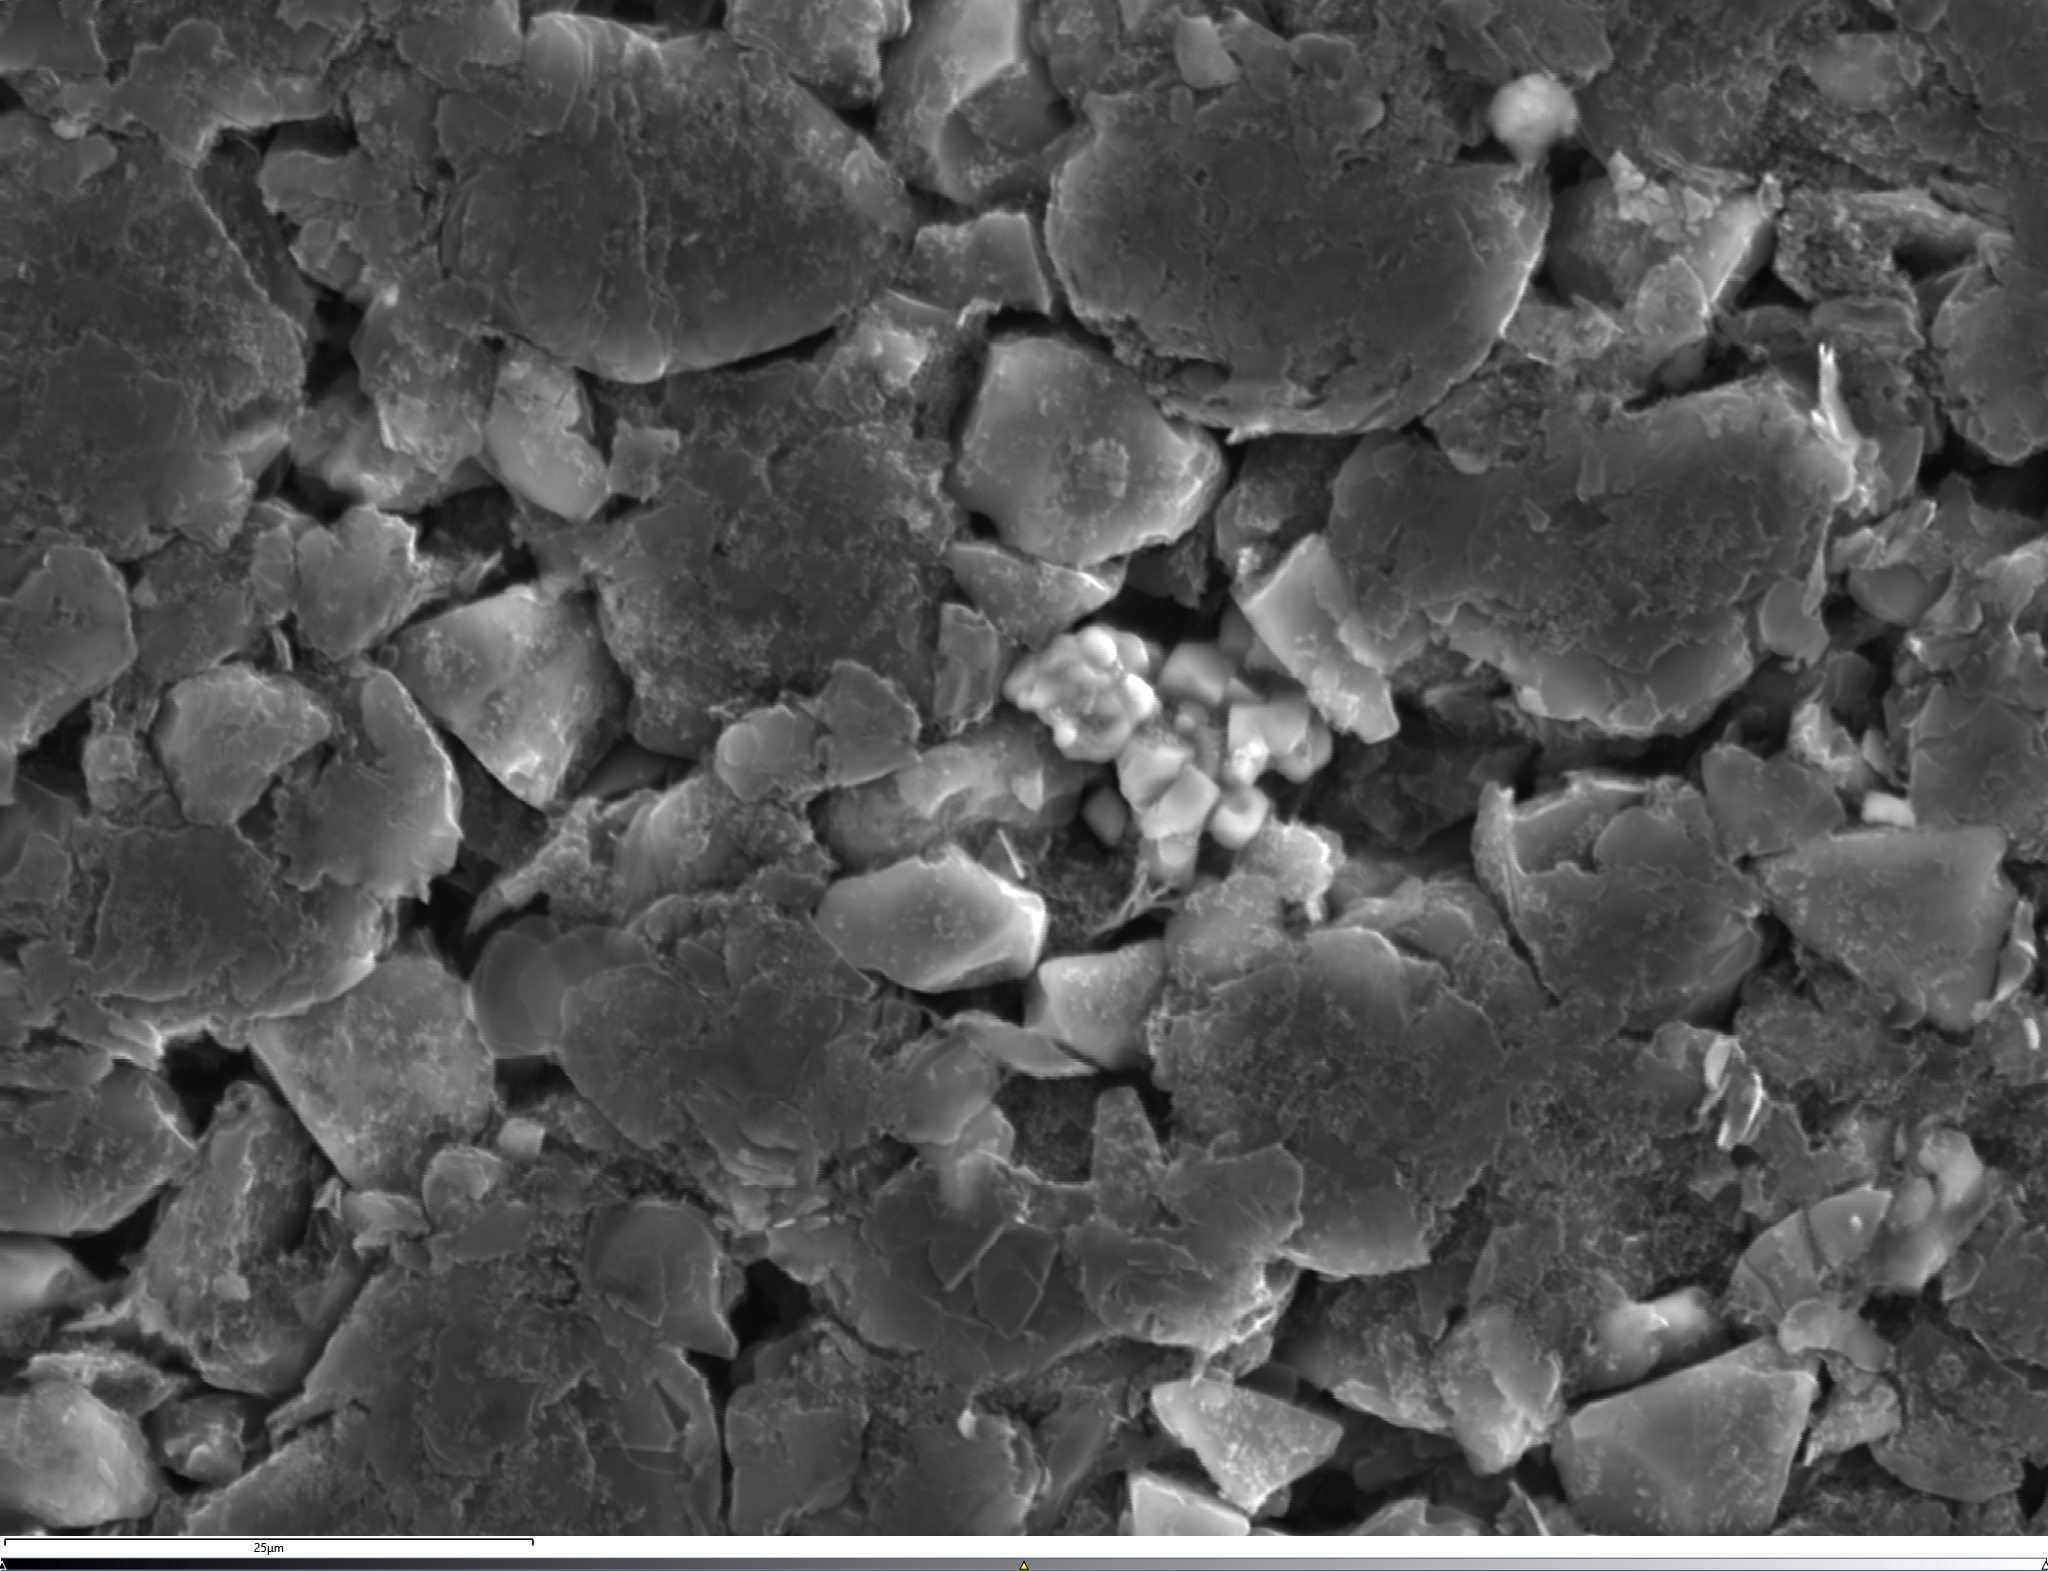
Figure 3 Ti contamination (in green) within SiC anode. C in purple and Si in red. Mapped with Ultim Max.
Figure 4 Cu contamination (in green) in SiC anode. C in purple and Si in red. Mapped with Ultim Max.
Formulation testing: High Resolution Imaging & Quantitative Analysis
Apart from routine particle analysis for contaminant detection, more advanced analytical work can be done to ensure the enhanced quality of battery materials. One key topic is improving cathode materials’ performance with cycling. To achieve this, certain additives are often added as dopants (Figure 5) to battery powders to increase their resistance to degradation (cracking) and suppress dendrite formation. In the example featured here, ZrO can be seen on the surface of the NCM811 particle (right, middle). Zr doping instead of coating is thought to increase the number of cycles and achievable capacity (Kaur and Gates, 2022). The ZrO particles were detected using Ultim Extreme in a FEG-SEM.
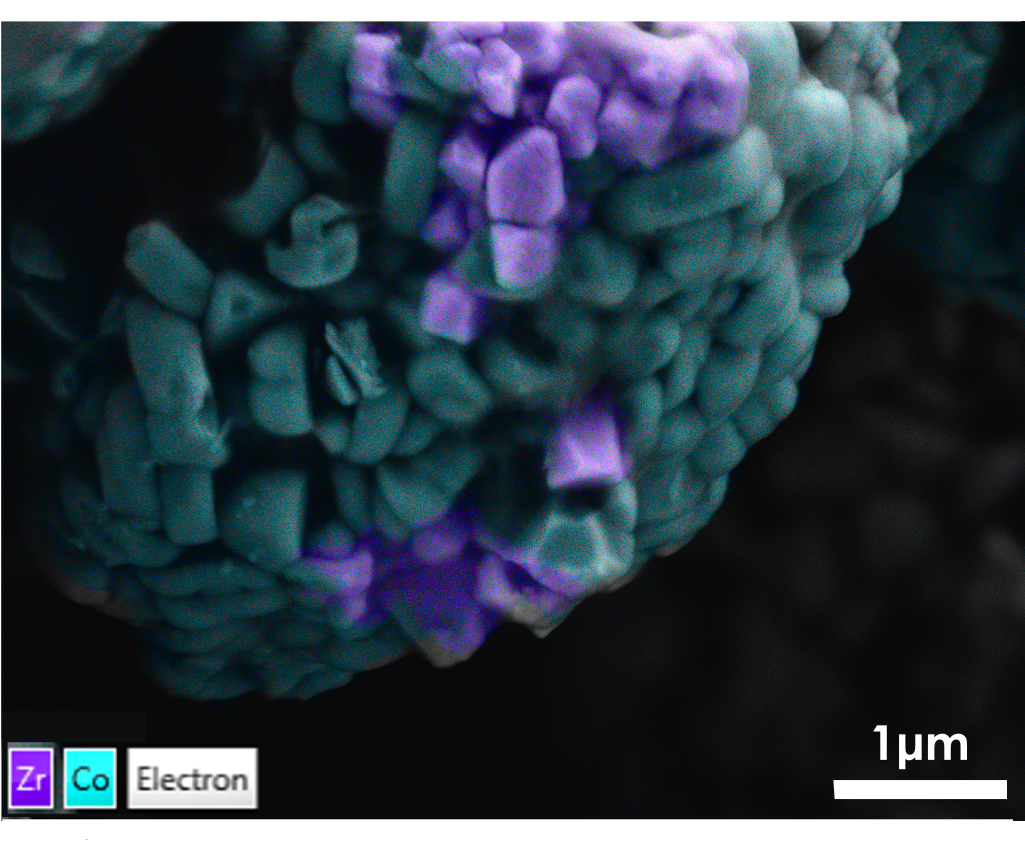
Figure 5 ZrO dopants (in purple) on NCM811 particle surface, mapped with Ultim Extreme.
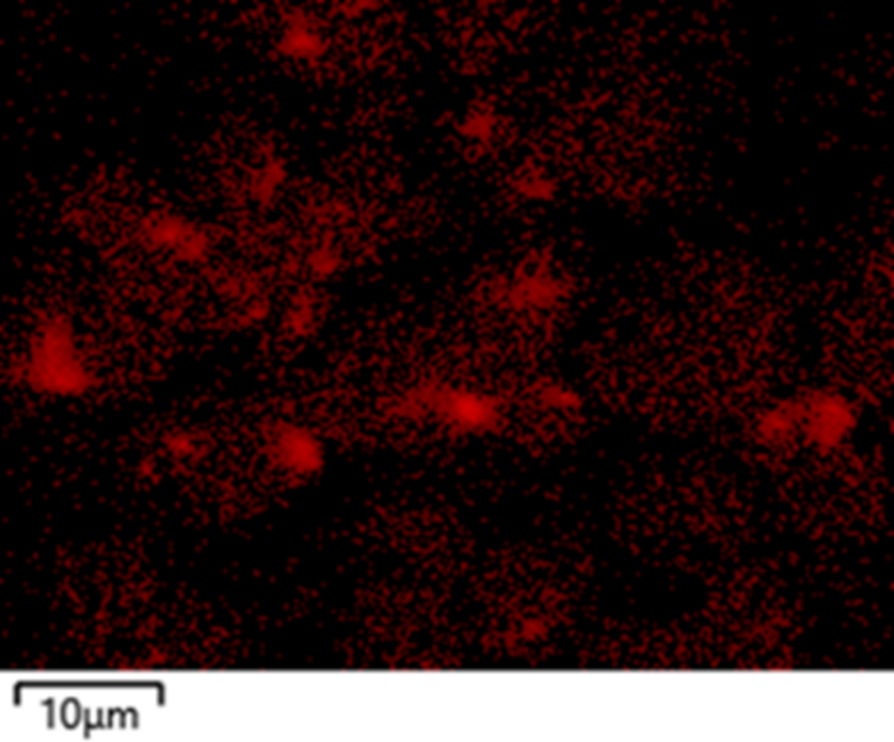
Figure 6 SEM-WDS mapping of Zr in the same NCM811 powder.
ZrO was found with EDS (Figure 5), and WDS can be used as a complementary technique to quantify it. This can be achieved with WDS point analysis (for localised analysis) or with SEM-WDS (Wave + AZtecWave) mapping as shown in Figure 6. WDS provides additional reassurance in checking the presence of Zr due to its capability to map elements present at very low concentrations. (Note: The map data was collected from a different area compared to the area mapped with EDS shown in Figure 5).
Particle internal structure
Another aspect of battery powder characterisation is the analysis of particle internal structure. This can be investigated with SEM-EBSD.
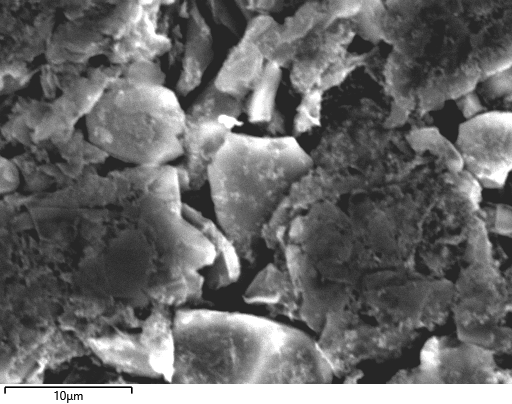
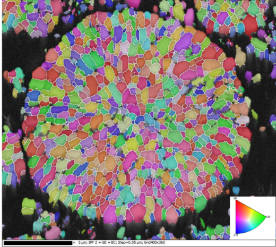
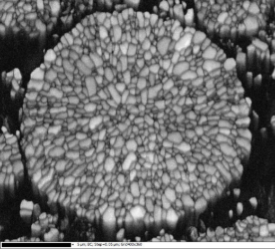
In Figure 7, the electron image of the NCM811 cross section on the top is difficult to use, because of the closeness of the atomic numbers of Mn, Co, and Ni (25, 27, 28 respectively), resulting in similar grey levels. The level of detail in the forescattered image (Figure 7, bottom left) is much higher than that of an electron image; the internal structure is clearly depicted and is less subject to errors. The IPFz map (Figure 7, bottom right) of the same NCM811 particle shows the different orientations encountered within the particle, clearly showing how complex its internal structure is.
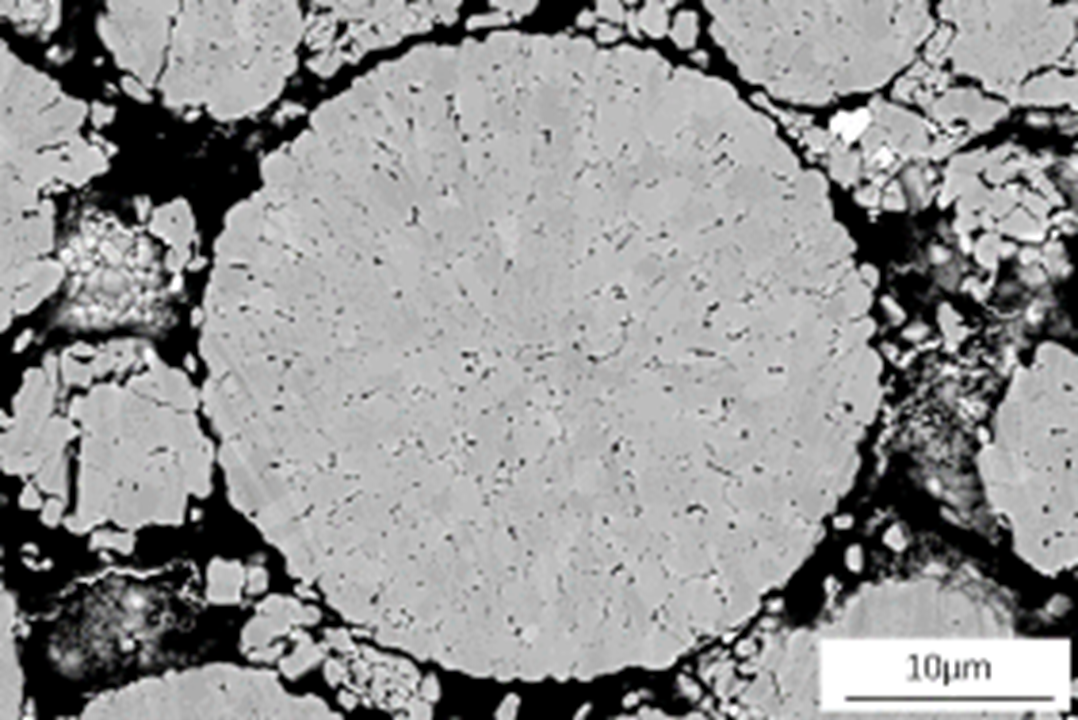
Figure 7 Top: Electron image of NCM811 cross section. Bottom left: Band contrast map of the same particle. Bottom right: IPFz map of the same particle. EBSD data collected with Symmetry.
Battery powder particles: the building blocks of the cathode
In this post, we touched on some of the topics that come up when battery materials are analysed. We started off with the individual NCM811 particles, looked at their composition and internal structure and now, in this high-resolution image (Figure 8) you can see what the finished cathode looks like. You can see how closely the particles are packed. (Please note that the crack under the Al foil was introduced during sample preparation.) The finished cathode also has to be carefully inspected; its structure changes as degradation starts building up with cycling.
Figure 8 Finished cathode, EDS map (Al in light blue, Ni in green, F in pink). Mapped with Ultim Extreme.
The main take-home-message from this National Battery Day blog post is that QA/QC can be performed in different ways and different types of information can be obtained, but the bottom line is that it is invaluable. Regardless of whether your is objective routine QA/QC or advanced R&D applications, Oxford Instruments can help you get the results you want, fast.
References
Kaur G, Gates BD. Surface Coatings for Cathodes in Lithium Ion Batteries: From Crystal Structures to Electrochemical Performance. Journal of The Electrochemical Society. 2022 Apr 8;169(4):043504.