The 10th October sees me back in the presenting chair, with a webinar entitled, "What is cutting edge in SEM-EDS technology Today?" I will present a condensed version of a seminar I presented at the M&M conference in Cleveland, Ohio this summer. This seminar was an educational session during which I focussed on some of the technology issues that limit what EDS can do. It aimed to show how these limits are far beyond what was possible even a few years ago and these limits may truly surprise you.
Preparing for the webinar started me thinking that it must be more than 20 years since the ISO standard specifying the performance of EDS detectors was introduced and made me wonder whether it has helped users select cutting edge EDS equipment.
ISO 15632 - Performance parameters for the specification and checking of energy-dispersive X-ray spectrometers (EDS)
ISO15632 is a standard from the International Organisation for Standardisation which sets down a basic set of guidelines you can use to understand the performance of EDS hardware (detectors and their processing electronics). It was introduced in 2002 and refined and re-published by a technical committee of international experts in 2012 and 2022 to reflect advances in technology. Afterall, in this period, EDS technology has changed from LN2 cooled Si(Li) detectors to SDD detectors with ever increasing speed and sensitivity.
One key section of the standard, section 4.2 in the latest 2022 version, is little changed since 2002. It states that the energy resolution shall be specified as the FWHM of the manganese Ka peak. So, no surprise there then, except it then continues for spectrometers that claim detection of X-rays less than 1 keV. In other words, pretty much every EDS detector sold in the past 30 years, and any that claim to be able to detect carbon, boron, beryllium or even lithium, i.e. the one you are using, so read on. For all modern EDS systems like these, section 4.2 continues to state that, these must also be specified by the FWHM of the carbon K and fluorine K lines. It then goes on to include the need to state the count rate for which this specification is valid. So, three resolutions for three different X-ray lines, each with a count rate range at which the resolution can be achieved.
Why is specifying at MnK not enough and CK and FK resolution important?
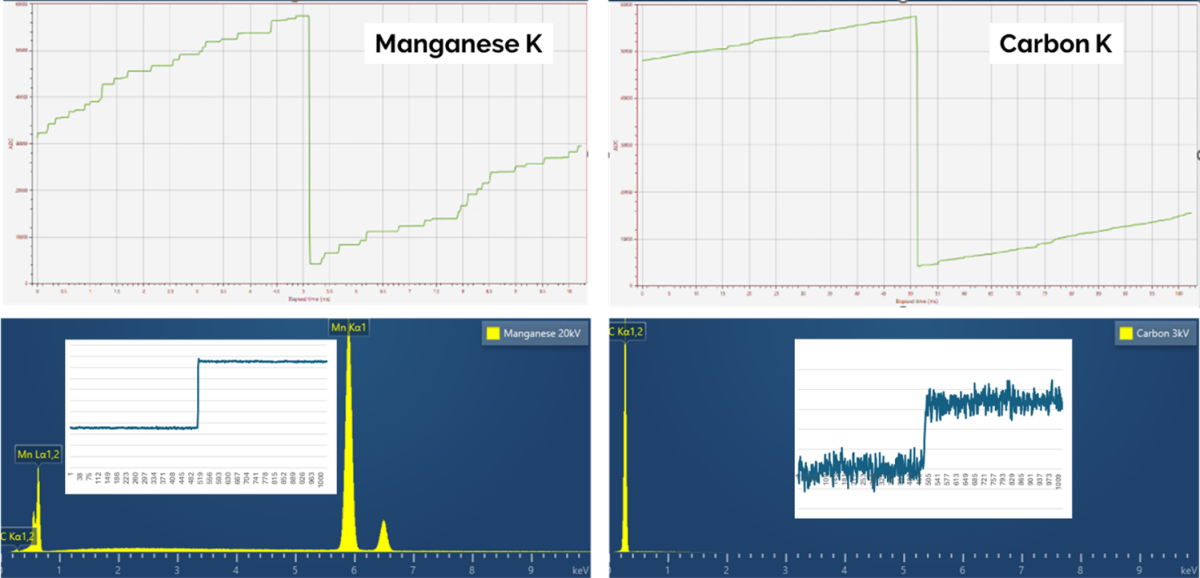
Perhaps the way to answer this question is to start with looking at the signal coming out of a modern EDS detector from MnK and CK. On the left is the output from pure Mn at 20 kV, on the right from carbon at 3 kV. Each of those steps on the voltage ‘ramp’ is a detected X-ray, and it is the job of the pulse processor to count them and measure the height of each one to determine its energy. However, note that in the case of CK, whose energy is over 20 times lower than MnK, these steps are hardly visible and much tougher to measure. You can see that below where I have blown up a step for each case, and you can see the relative level of noise and therefore uncertainty in the signal measurement is much higher in the case of carbon. So, although we can see in the spectra the carbon peak is actually narrower, and therefore its resolution is better than the manganese peak, the actual resolution will be far more affected by the level of noise and ability of the system to shape it accurately.
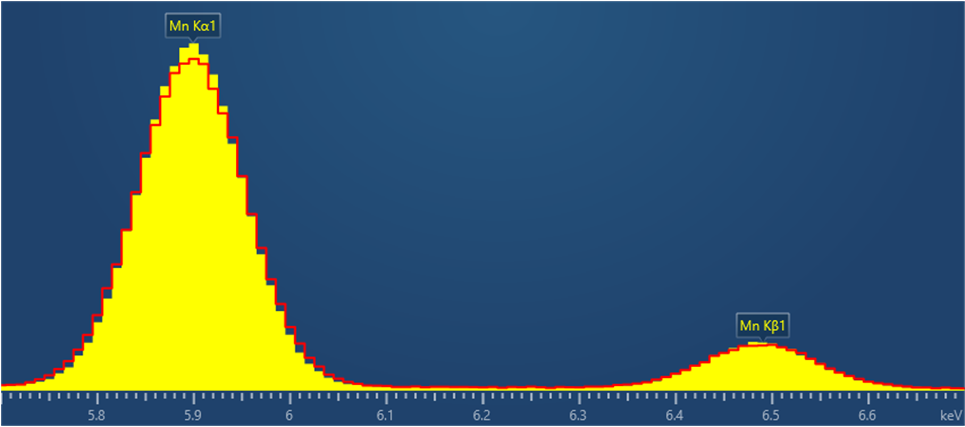
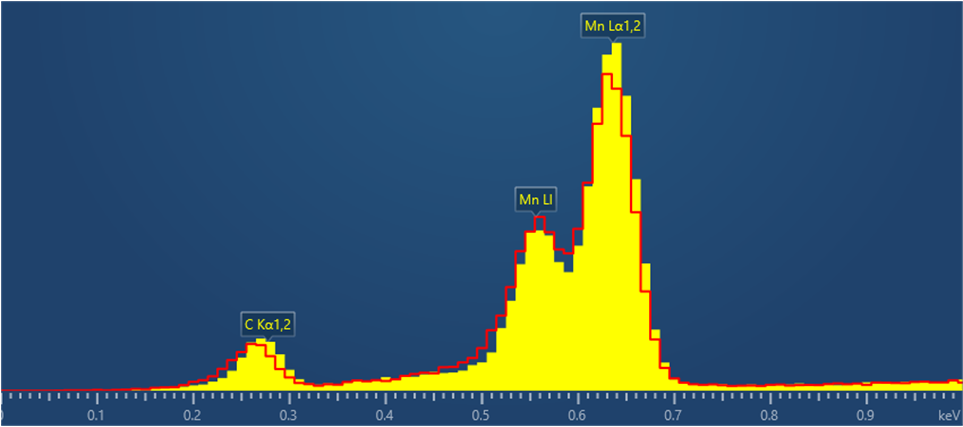
Let’s look at that by considering two EDS detectors with similar MnK resolution specifications. So similar in fact that their MnK peaks look almost identical, and the Kα and Kβ peaks are easily separated.
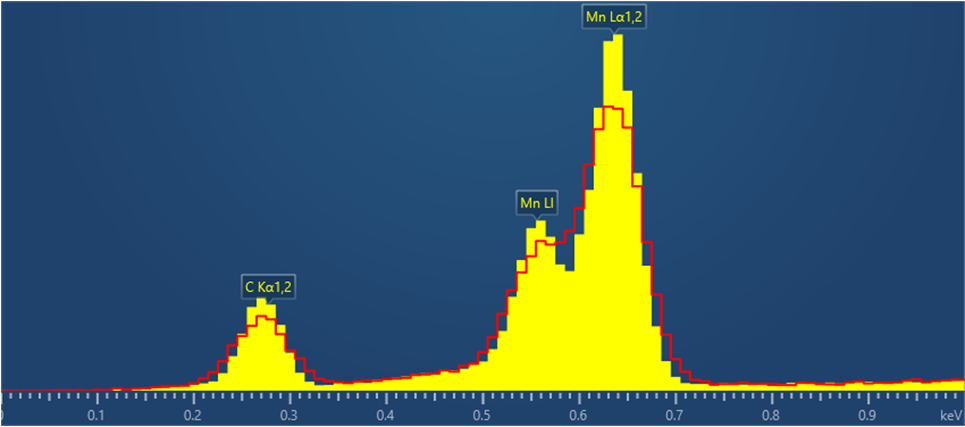
For these two detectors, however, things look a bit different at 677 eV around the energy of the MnL lines. In this case, the yellow spectrum clearly shows the MnL peak as separate MnLl and MnLα lines, however for the red spectrum, from the other detector, the resolution is significantly worse, so much so that the Mn line shape is no longer distinct.
The difference in the Mn resolution for these detectors is only 5%: 124 vs 131 eV but is around 35% at low energy (46 vs 62 eV measured at CKα). This is one reason for the CK and FK specification, as low energy resolution is far more sensitive to variations in detector noise, and therefore the capability of a system to accurately measure the steps on the output ramp from the detector.
There is a major additional reason to specify detectors at CKα
One other thing to bear in mind is there is another property of a detector that influences low energy performance, and it can’t be predicted at all by Mn resolution. This is the amount of incomplete charge collection (ICC) due to the quality of the front contact of the SDD sensor.
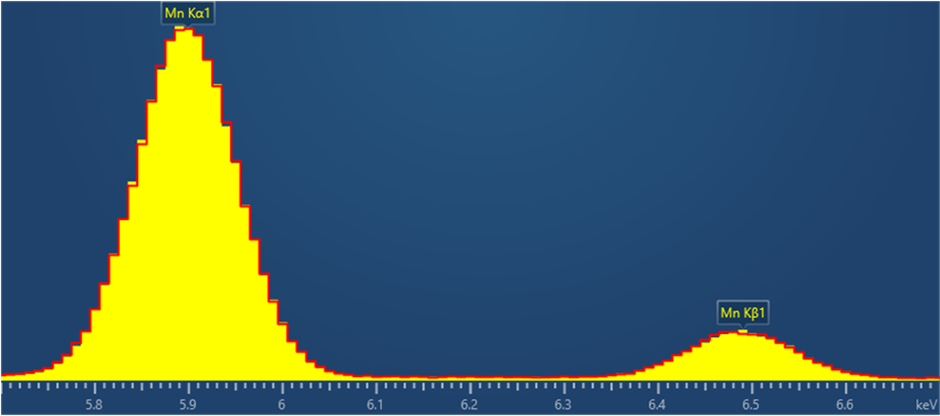
So, look at two different detectors again, in this case ones with identical Mn resolution, in this case both have MnK resolution of 124 eV, and therefore identical Mn spectra at MnK energy.
However, the one giving the yellow spectrum has a higher quality front contact with significantly less ICC, than the one giving the red spectrum. This becomes apparent when we look at the low energy part of these spectra, where the yellow spectrum shows better resolution, but more importantly, the carbon peak on the red spectrum is shifted to lower energy. This will cause spectrum processing errors affecting the accuracy of AutoID, mapping etc. In this case the detectors have identical Mn resolution, but low energy resolution differs by 15%, the yellow spectrum has CK resolution 46 eV the red one 52 eV. This is the other important reason for including CK resolution in the standard to measure the performance of an EDS detector.
Is detector resolution even that important these days?
Arguably, Mn resolution has less importance for EDS system performance these days. As we have seen, the separation of high energy peaks is large compared to the resolution. Peak shapes should also be predictable and not affected by ICC. Modern spectrum processing algorithms can do an excellent job at separating these peaks if it is required. Even at high count rate, the resolution should not degrade too much, but this can be confirmed if the other part of the ISO specification information is provided, the count rate range at which the resolution specification is valid. Section 4.2 of the specification also specifies that in addition the energy resolution is to be specified at higher count rates of at least 50,000 cps, if the best resolution can only be achieved at a low count rate.
For low energy and light element analysis however, where noise and incomplete charge collection are important and the peak separation is, taking the example of MnL vs MnK, 7.5x smaller, resolution is critical, and a systems capability can only be assessed if specified at CK. Any of you collecting spectral data at 1000 eV or less, in other words anyone using 10 kV or less to improve spatial resolution for nano-characterisation, or analysing light elements such as B, C, O, N and C, present in so many materials should be beware of this. Does your hardware perform as well as you suspect?
Take for example, this complex inclusion microstructure in a super-alloy, which was characterised at 3 kV due to its smallest structures being around 30 nm in size.
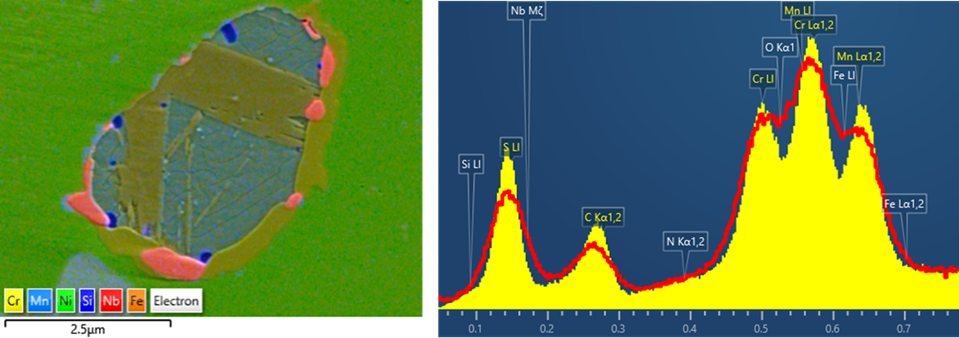
This composite image only shows some of the elements in this part of the sample. The spectrum display shows the elements present in the largest phase, with some of the elements present in other phases also labelled. The red spectrum is from a detector with 58 eV resolution at CK, the yellow 41 eV, as before the MnK resolution of these detectors by contrast is similar. When correcting for overlaps in an X-ray map to give correct elemental distribution, the signals for all the elements present have to be separated. To give you an idea, here are all the low energy lines that the system is processing to create the map data above, for the 41 eV detector on top and from a detector with 70 eV resolution at CK below.
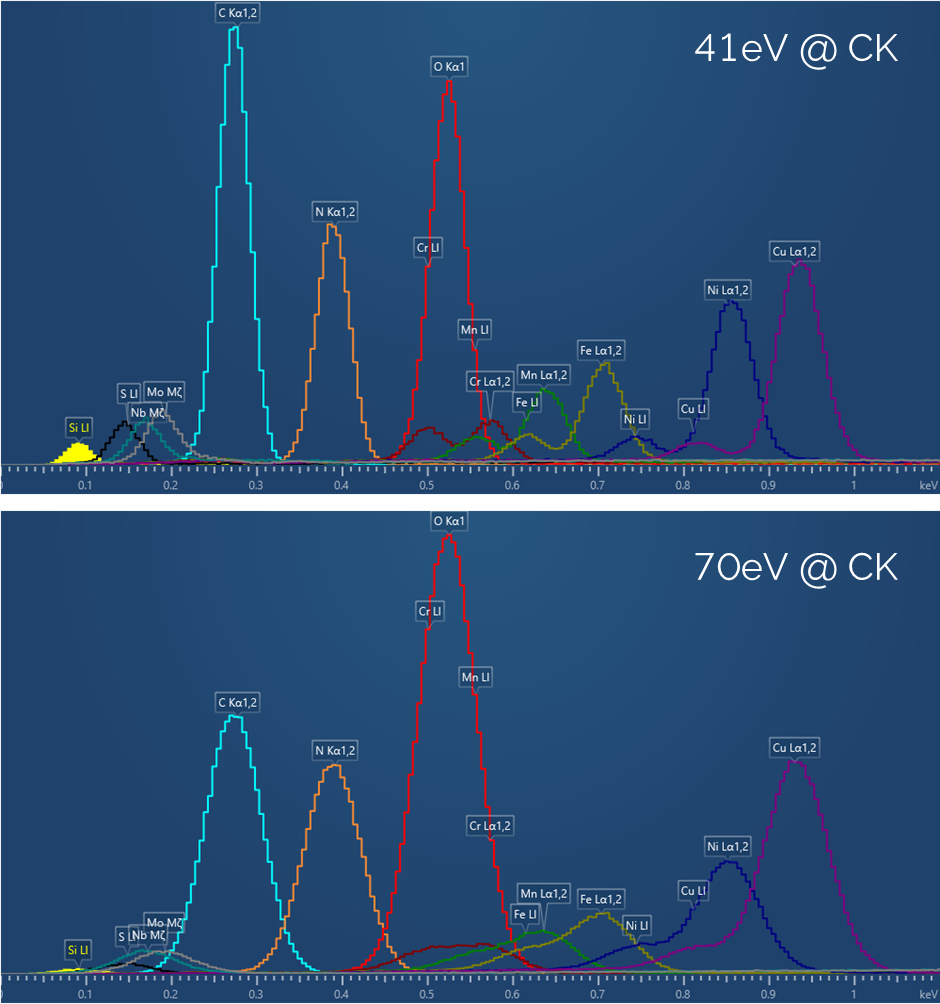
At low energy, and for complex samples every bit of resolution improvement helps. It's one of the reasons we still use longer process/shaping times for nanoanalysis.
However, resolution is far from the only story for EDS performance. As you will see in my webinar, I will also be looking at fast, high sensitivity micro-analysis, and showing how maximum throughput is, like MnK, a poor performance predictor. You can achieve some incredible results at high count rate, but not if you insist on running at throughputs you will see on some spec sheets.
ISO15632 22 years on, where are we now?
The aim of ISO15632 was to ensure users can assess the performance of different EDS systems using measures relevant to their requirements. Unfortunately, my perception is the impact of ISO15632 in guiding the analysis community to assess detector performance to fit analytical needs has been limited, and in one way potentially in some cases counterproductive. I say this for a number of reasons:
- People our community who ask me about, or discuss, spectral resolution almost always seem to be thinking about MnK resolution. I am asked if a 124eV detector is possible, no one asks for a 45eV detector (at CK), which in almost all cases would be more useful.
- Similarly, I can’t remember the last time anyone asked about the count rate range at which a particular detector achieves a particular resolution.
- A quick search of the web for current EDS systems reveals lots of information on MnK resolution, but hardly anything on CK or FK, let alone any information on count rate.
- Specifications where present often are worse, or absent for large area detectors, promoted as the solutions for nano-characterisation, whereas we have seen, low energy resolution only becomes more critical as low kV collection for high spatial resolution is more important.
- This is particularly shocking as the number of systems that claim some kind of compliance or even performance beyond ISO15632 is significant.
- The number of tenders that ask for even a small number of performance measures in ISO15632 is small, MnK is often the only one. Some tenders ask for ISO15632 compliance, and will be accepted without any specification for FK, CK, let alone count rate or high-count rate.
Therefore, in many cases, I fear ISO15632 has led to the need for the performance of systems to be correctly specified for today’s nano-characterisation challenges to be hidden, misunderstood or assumed, when not all of the required performance measures, let alone guarantees, are in place.
When CK resolution becomes the standard for measuring EDS detector performance, and the other measures in the ISO15632 standard are routinely presented and expected, then this key part of the standard will be meeting its aim.