Following on from the successful introduction of AZtecMatch, we have decided to rerun the Tutorial on 7th December. I thought it would also take the opportunity to highlight this new capability within AZtec, to automatically identify an acquired spectrum, making the process of sample identification easily accomplished even by a relative EM beginners.
Enjoy this post, and if you’d like to learn more, please register here.
The Guru
Most of multi-user EM Labs will have a guru or expert, who is considered the font of all knowledge. This will be the person to whom everyone goes for help. They can look at a spectrum and tell you exactly what the sample you are analysing is or what the contaminant you have found is and where it came from. They will be able to give a brief history of the origin of the contaminant and when they last came across it.
These people are invaluable to an organisation, which can in turn cause issues. For example, when this guru/expert is away from the lab, there can be delays with day-to-day completion of jobs. This can be because they are the only one who can identify a contaminant and confirm its origin. I have been to labs such as this, where the guru complains that when they come back from vacation, they are always greeted with a long list of tasks that they would consider simplistic jobs. I have often heard them say, “I wish I could put some of my knowledge into the EDS software”.
AZtecMatch
Our new software package ‘AZtecMatch’ does exactly this, by taking a little of the guru’s knowledge and making it available to fellow users. If I was asked to give a definition of AZtecMatch, then I would say it gives the capability to automatically identify an acquired spectrum. It works by looking at the quant from an acquired spectrum and matching the results against a database of known standards. It then lists the top 3 matches for the user with a colour coding to indicate the likelihood of the match.
AZtecMatch comes with a minerals database as standard, but users can create their own based on their own applications and samples. This is where the guru user inputs some of their sample knowledge into AZtecMatch.
How does AZtecMatch integrate into AZtecLive
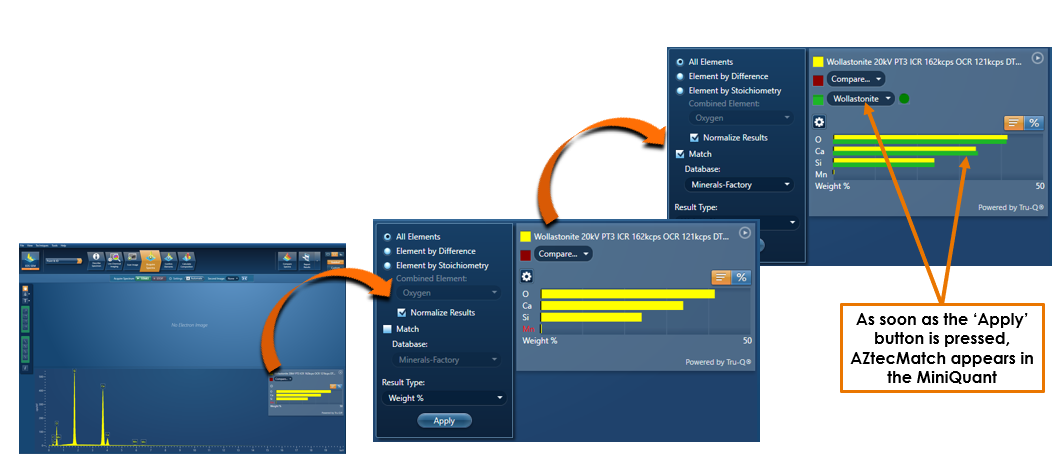
For those who are not familiar with the AZtecLive software, when we acquire a spectrum, the quant results are calculated instantly and shown in a data display within the spectrum viewer caller ‘MiniQuant.’ This MiniQuant viewer is able to show the quant in either graphical or numeric form. It can also show the results of a comparison spectrum, as well. We have implemented the AZtecMatch functionality to work within this panel.
All you need to do is turn on AZtecMatch via the settings cog, and you will see a new comparison window in the MiniQuant, along with a set of comparison quant results. So, like the manual spectrum comparison capability, you’ll see the quant results compared in graphical and numeric form. The selection of the comparison data is automatic and is based on the closest match in quant results between the acquired spectrum and the standards in the AZtecMatch database.
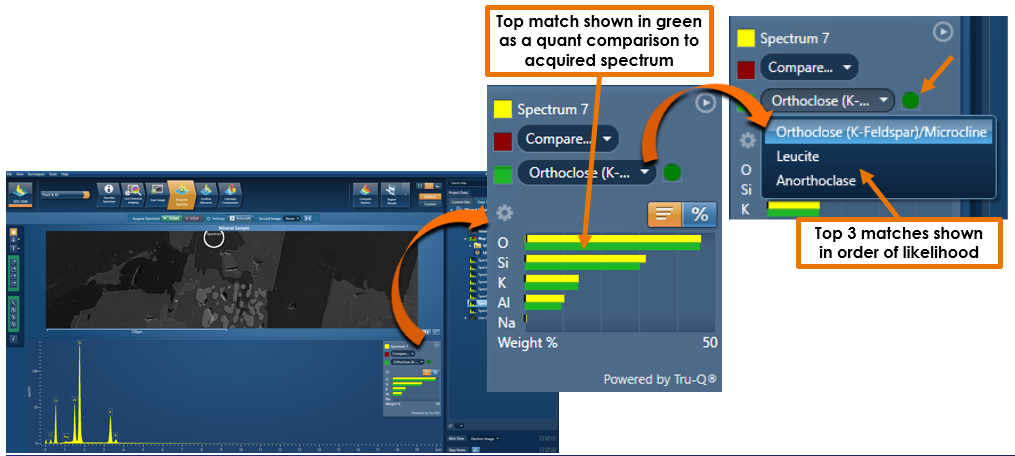
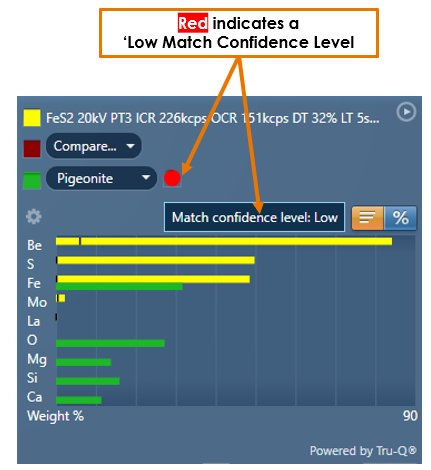
In addition to AZtecMatch automatically selecting the best match to display in the MiniQuant, it also shows you the next 2 closest matches too. These can be accessed via the drop down,
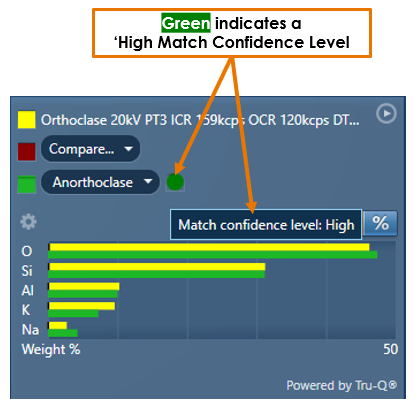
There is also a colour key to indicate the quality of match:
If the colour of the first match is green, then you can be confident that the match is good.
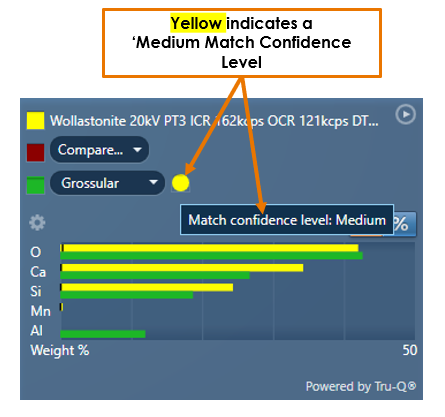
If the colour of the first match is yellow, then it is likely that there is no good match in the database.
Although there is still a possibility, if for example, the standard is known to vary naturally by either element percentages or by the addition of an element. Or the additional element is present in a substrate or coating perhaps. So, in these cases, it is still likely that the lab expert would be needed to make a judgment call. On the plus side, if the judgement is that this sample is in fact a variant of the standard in the database, then it can be added to the database for future use.
Finally, if the colour of the first match is red, then it is most likely that there is no match for the acquired spectrum in the database.
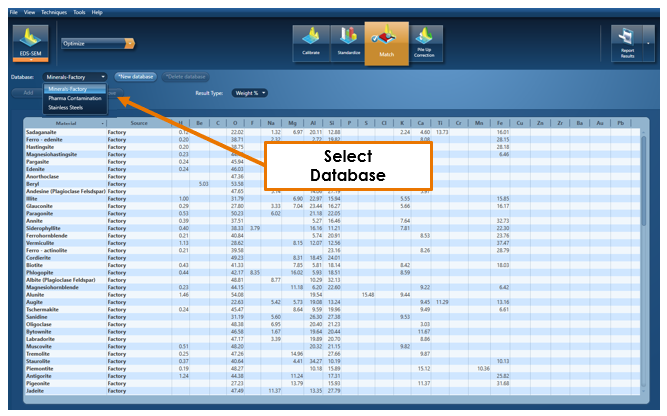
You can create as many sample-specific databases as you like and easily switch between them.
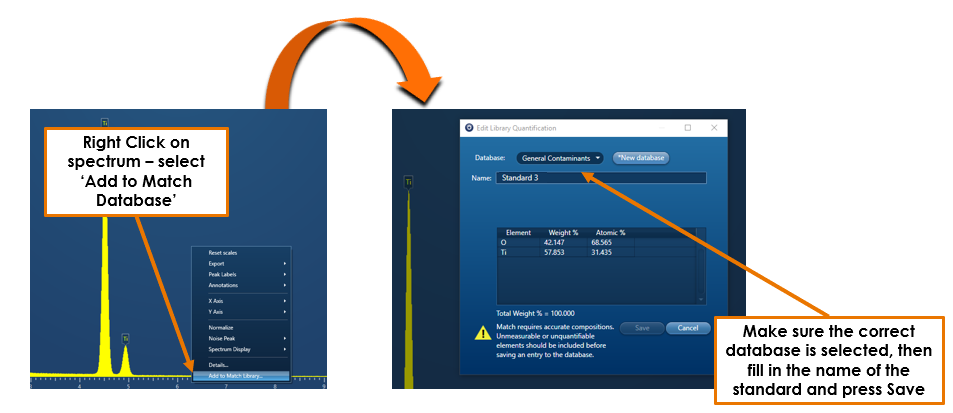
Adding new samples to an existing database is easy too, right click on the spectrum and select ‘add to Match Database.’
Spectrum Synthesis
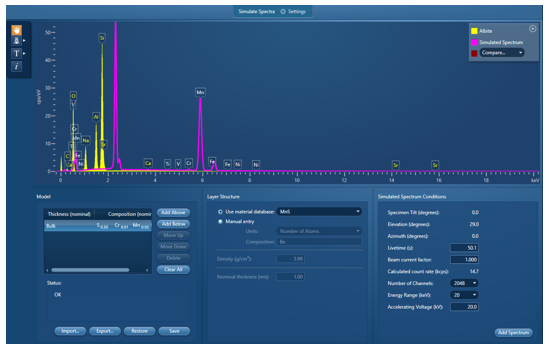
You can even create a standard by using Spectrum Synthesis. This functionality is included in the LayerProbeONE and LayerProbe applications and is used to check the visibility of minor and trace element peaks under varying conditions. This is ideal for helping you to discover the optimum analysis conditions for your analysis even before loading your sample. And of course, the final thing is the ability to create a spectrum that can be used to create a standard for an AZtecMatch database.
So, there we have it. EDS gurus, and other users, can finally input a portion of their sample knowledge into AZtecLive in the form of AZtecMatch, and it’s capability to automatically identify an acquired spectrum.