I have a confession to make. Despite being involved in plenty of research that has brought together different analytical techniques, as well as being a co-author of a book chapter that extols the virtue of correlative fluorescence and electron microscopy, I have a deep suspicion of correlative microscopy. This probably stems from a talk I listened to at a microscopy conference almost 20 years ago, where a representative of one of the main manufacturers of microanalysis systems presented some EDS mapping results using an early automated phase mapping system. The example he showed was from a thin section of an igneous rock, and he correlated the EDS maps with the light microscope images from the same area. The message was clear – “look, we can identify the mineral phases using EDS mapping and they correlate well with light microscopy results”.
As any geologist will tell you, one of the most important skills you can learn is the use of a petrographic light microscope: with the use of cross polarised light, it is possible to determine the phases in a thin section with remarkable reliability in just a few minutes. Think about this – a few minutes inspection of a thin section using a microscope that might cost a few thousand dollars and you will have the information you need. Why then would you want to take many hours using equipment that costs hundreds of thousands of dollars to replicate the same information? It’s an example of where we lose sight of the goal of our analysis.
Correlating complementary techniques
However, where correlative microscopy does make sense is when, instead of one technique replicating or confirming the results from a second technique, the results from each technique truly complement each other. The most common example is where the unique information from fluorescence microscopy of life-science samples is correlated to the higher-resolution ultrastructural information derived from electron microscopy. The 2 sets of information work together to help us understand the nature of our samples. In my field of expertise, EBSD, we frequently use a form of correlative microscopy to help with the successful indexing of phases: in this case the correlation takes place in real time, by combining compositional data from simultaneous EDS measurements with the EBSD pattern indexing process in order to distinguish between phases with similar crystallographic structures.
Understanding failure using a correlative approach
Recently, I have been involved in a fun project that has effectively used correlative microscopy to solve a challenging, real-world problem. In the nuclear power industry, dissimilar metal welds are required for a number of critical parts in the cooling system (for example, the inlet nozzle in a pressurised water reactor). These weld interfaces are susceptible to failure which, of course, could result in catastrophic consequences. In collaboration with FemtoTools, a company specialising in nanoindentor systems, we have examined in detail some dissimilar welds between a Ni alloy and a low-alloy steel. Nanoindentation mapping highlights significant variation in the physical properties, in particular the hardness, across the weld interface, as shown below.
Map showing hardness variations across a typical weld interface between the low alloy steel (far right edge of the map) and the Ni alloy. Note the high hardness values adjacent to the interface. Image courtesy of FemtoTools. Image courtesy of FemtoTools AG.
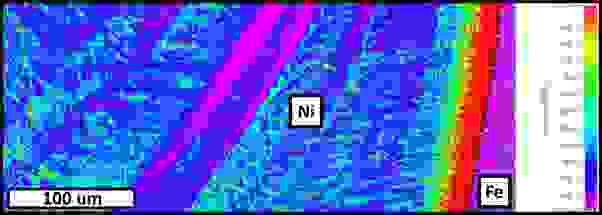
This abrupt change in physical properties within the Ni alloy and across the weld interface can result in localised embrittlement, resulting in component failure. However, the question still remains – what is causing the localised hardness variations? It is here where correlative microscopy really can help, in this case by analysing the same area (prior to the nanoindentation mapping) using EBSD and EDS mapping. In the animation below, you can see that the physical properties in the Ni-alloy (here shown using a Hardness / Reduced Modulus map) correlate closely with the local changes in orientation (as shown using an EBSD disorientation colouring map).
Animation comparing the hardness / reduced modulus (H/E) variations and the localised orientation changes across a typical weld interface between the low alloy steel (far right edge of the map) and the Ni alloy.
Correlation highlights a complex story
As is often the case, the final story is not as simple as we might have first thought. It is only when we start looking at the compositional variations in the Ni alloy that the true story emerges – the relative abundances of Ni, Fe, Ti and even C all explain the changes in physical properties in different areas of the sample. Perhaps the most interesting of all is the carbon content within the Ni: we know that C exists as an interstitial species in the face centred cubic (FCC) Ni structure, resulting in distortion of the lattice and localised hardening / embrittlement. This, in turn degrades the quality of any EBSD patterns from these C-enriched areas: we can see this visually as a blurring of the Kikuchi bands (as shown below) but it also changes the lattice parameters (e.g. the c/a ratio of the crystal lattice).
Comparison between EBSD patterns from the Ni alloy collected in a low-C region (sharp) and a high-C region (blurred).
With the advent of advanced pattern matching methods, as implemented in our AZtecCrystal MapSweeper software, we can start to measure that lattice distortion. Such an approach has been used before on martensitic steels (see Winkelmann et al. (2018), Physical Review Materials 2, 123803), and I was curious to see what this would show in these dissimilar weld samples. Luckily, I have access to development versions of our software and was able to test this functionality using a beta version of MapSweeper: the results are very interesting and provide a further layer of information that we can correlate with the measured physical properties, enabling a more complete understanding of potential failure mechanisms. In short, it is the carbon content that is key to the failure of these welds. To find out more about this fascinating case study, you will need to listen to an upcoming webinar that I am presenting with my collaborators from FemtoTools on November 9th. You can register for this webinar here.
For those of you that wish to start measuring lattice distortion using AZtecCrystal MapSweeper, you will have to wait for our next release – but the wait should be worth it. In the meantime, my suspicion about the value of correlative microscopy has been significantly tempered by this project. As long as the techniques truly complement each other with different information about our samples, correlative microscopy really can solve problems and is definitely worth the effort.