Join me in this blog post as I uncover the recent results from a very exciting product demonstration for Historic England. In this post, you will uncover the ‘fact checking’ ability of our TruQ algorithms for peak deconvolution. Furthermore, we will also cover the beautiful, backscattered electron and X-ray (BEX) imagery obtained from a series of wallpapers and phase separated glasses.
Fact checking glass compositions
Throughout history, the processes and materials involved in glass manufacturing have undergone significant transformation1. Importantly, changes in the elemental make-up of glass are known to appear at certain points of history, correlating with expanding trade networks or technological innovation. For example, the antimony (Sb) and lead (Pb) content of Roman glass waxes and wanes throughout the 1st-3rd centuries AD1, providing an insight into evolving manufacturing processes as well as a well-resolved dating reference.
However, glass can be particularly challenging to quantify using energy dispersive X-ray spectroscopy (EDS). Antimony, for example, has a challenging peak overlap with Ca which is difficult to recognise in an EDS spectrum when both elements are several wt.% in abundance. During the demo, I was tasked with identifying the presence of Sb within Ca bearing glasses to demonstrate that OI technology could detect this insightful minor element. Processing an EDS spectrum in AZtec with ‘confirm elements’ provides a unique tool for manually identifying the presence of Sb within the EDS spectrum. It can be seen from Figure 1 that without Sb included in the element list, there is a mismatch between the theoretical, fitted and measured spectra.
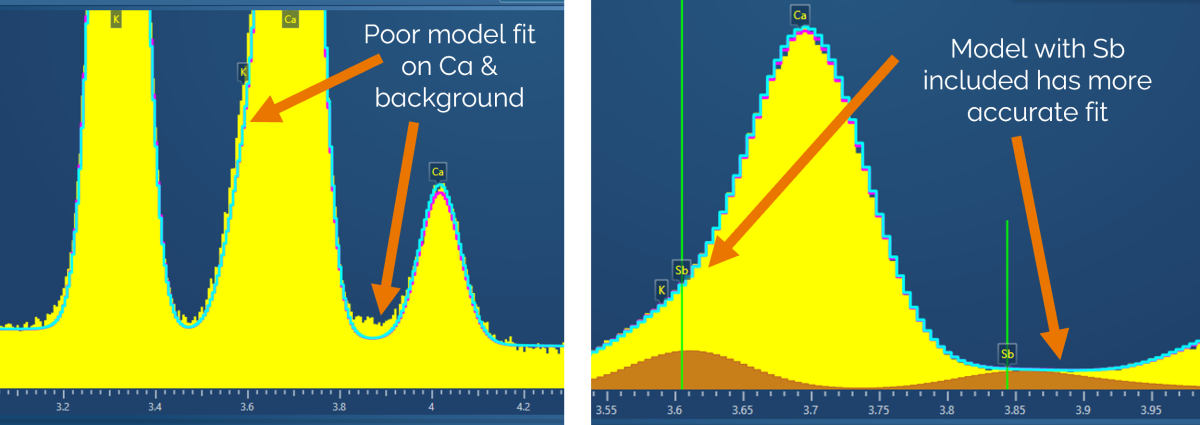
Figure 1: Sections of EDS spectrum collected on Ca-Sb bearing glass. These differences highlight the increased accuracy of the fitted and theoretical X-ray spectra when Sb is included during quantification. Blue line = theoretical spectra, Pink line = modelled spectra.
When Sb is added into the quantification, there is a more accurate modelled spectrum, shown by the greater agreement between theoretical, modelled and measured spectra (Figure 1). Think of this as a fact checking tool, we can clearly see from this example that the inclusion of Sb within the quantification creates a more accurate result. Thus, justification for the presence of Sb in the glass is provided, despite the Ca interference!
Once we had performed quantification, we turned our attention to backscattered electron and X-ray (BEX) mapping of replica glass beads. Similarly, the beads contained Sb and Ca which appeared to reside within the same areas of the sample when displaying the raw X-ray intensity maps from Unity (Figure 2).
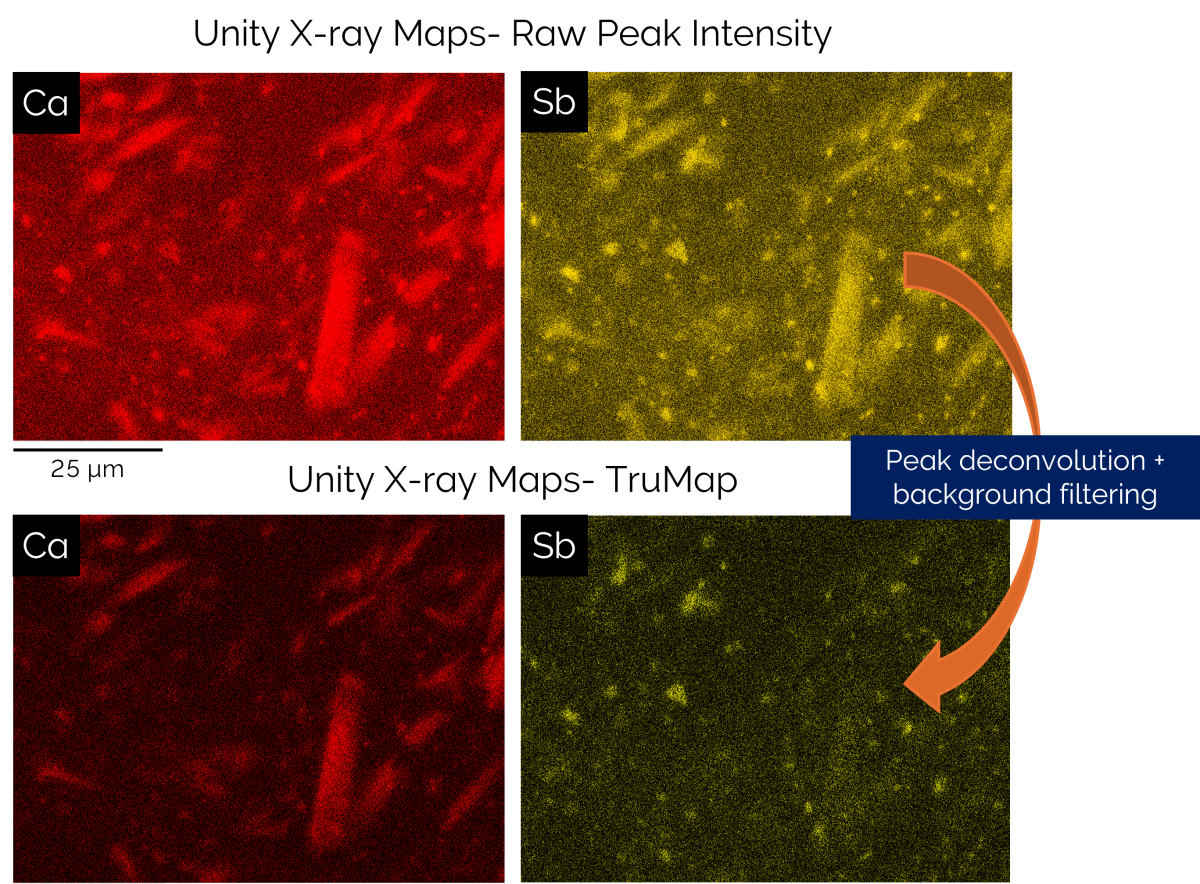
Figure 2: Unity X-ray maps displaying both raw intensity of Ca and Sb (top row) and X-ray intensity after TruMap processing. The end result is a clear separation of Ca and Sb into separate phases of the glass.
However, these unprocessed maps are somewhat misleading. Remember that Ca and Sb have a challenging peak overlap, therefore, Ca X-ray intensity can falsely increase Sb X-ray intensity, making it appear as though the two elements are co-located (Figure 2, top row). Calling once more on the fact-checking abilities of AZtec, we employed the use of our TruMap technology. TruMap processes the X-ray spectra from each pixel of the X-ray map to help deconvolute peak overlaps and filter out background. The result is visually impactful (Figure 2). TruMap clearly shows that Sb and Ca are NOT co-located and reside within separate phases of the glass. As a result, our understanding of elemental distribution within this glass artefact has completely transformed, accurately directing more targeted forms of analysis e.g. WDS quantification of Sb-rich phases.
Side note- Undoubtedly, this is the most clear-cut example I have seen for highlighting the importance of spectrum processing within X-ray maps. Due to the unique approach of TruMap, processing can be achieved at much greater speeds than quantification.
Peeling back the years: analysing wallpaper pigments with BEX
One of the fantastic things about my job is being able to work on novel samples that have previously been too challenging to analyse. The Historic England demo presented one such example, when I was presented with some precious wallpaper samples extracted from an English manor house. Unfortunately, these samples were not well suited to analysis using an electron microscope. Their precious nature prevented any preparation or coating, and being a wallpaper, they lacked conductivity. As a result, these samples presented difficulties with charging and X-ray shadowing. Fortunately, the Unity BEX detector is fully compatible with variable pressure mode and can be used at up to 20 mm working distance, greatly reducing charging and any damage caused by beam exposure. Furthermore, as Unity detects X-rays from beneath the pole piece, it greatly reduces shadowing on the rough unprepared samples and maintains high X-ray count rates even at large working distances. Following the BEX revolution, we were able to collect BEX maps from mm to µm scale (Figure 3).
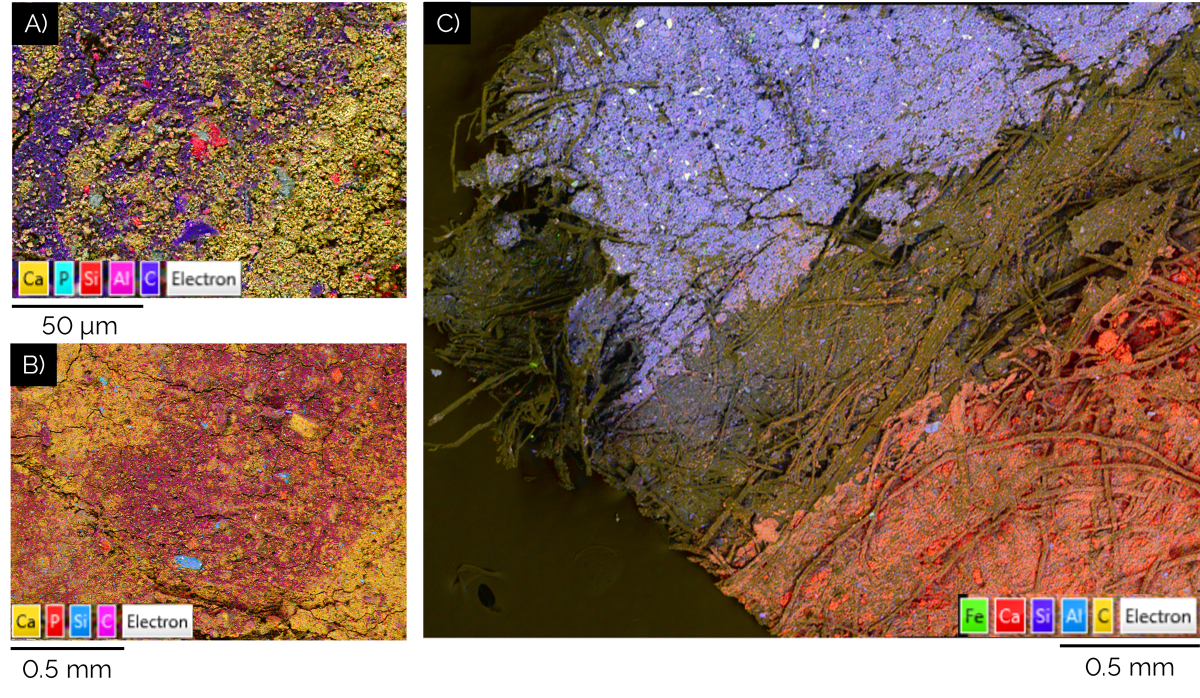
Figure 3: BEX images of wallpaper and pigments at varying degrees of magnification. Images collected in variable pressure mode. (A) Microstructure of dark grey C-Ca rich pigment. (B) Microstructure of blue pigment bearing fragments of lapis lazuli and P-rich material (Si-rich particles). (C) Large area BEX cartography displaying rough unprepared nature of wallpaper and the complexity of the different pigments.
Our analysis sheds light on the intensely complex microstructure of these wallpaper pigments, identifying components such as lapis lazuli which imparts a blue hue on the pigment. Due to the stratified nature of the wallpaper, a chronology of evolving pigments, material sources and patterns can be reconstructed with minimal sample damage.
The microstructure of a dull (?) phase-separated glass
The final sample analysed in the demo was a phase-separated glass, which had a rather dull brown and murky appearance. However, the glass bursts into life on the microscale displaying trove of dynamic cooling textures during BEX imaging (Figure 4).
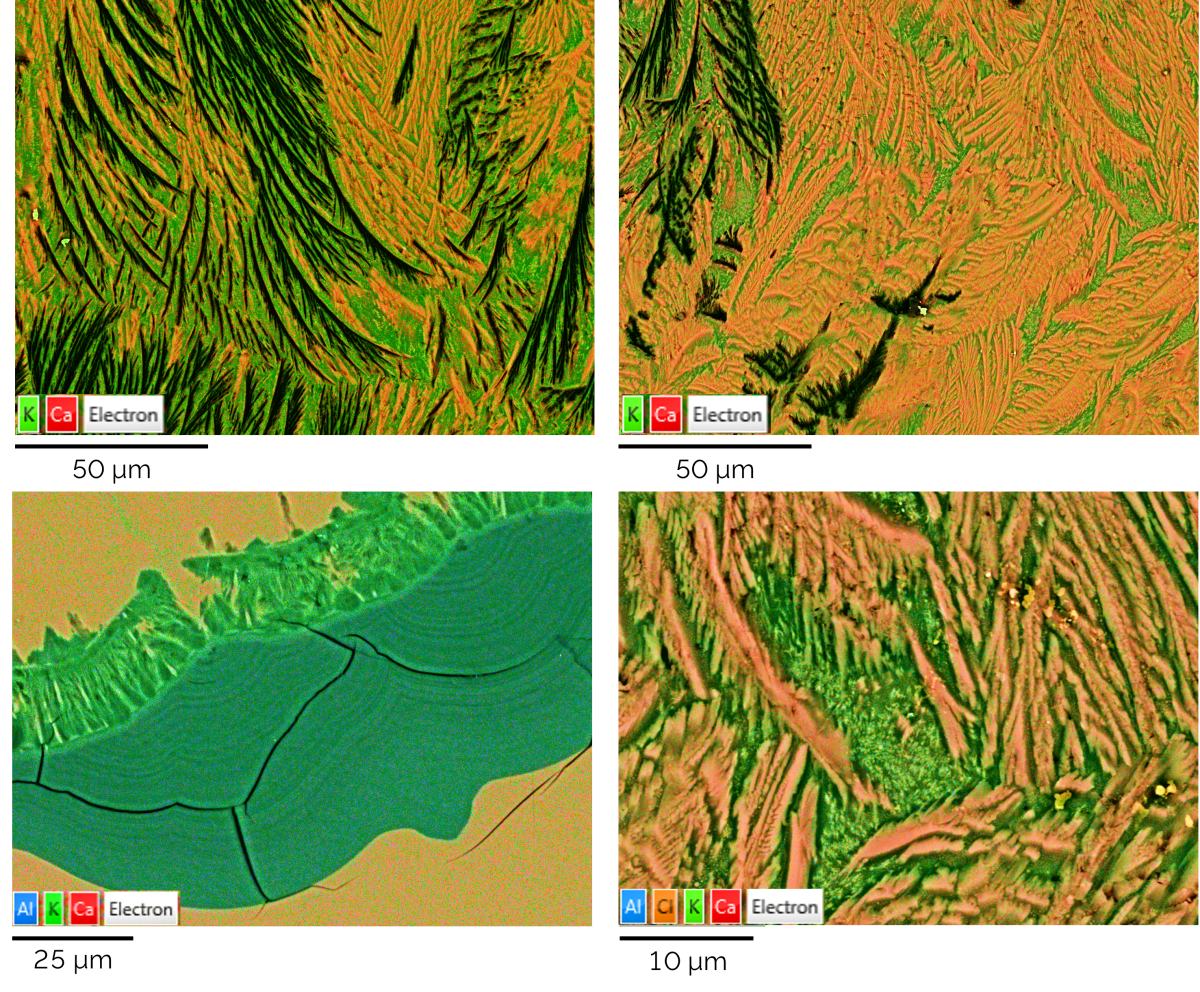
Figure 4: BEX images displaying the microstructure of phase separated glass.
The fern like structures appear in glass manufacturing when cooling is sufficiently slow that the elements contained within the molten glass migrate into two separate phases, as denoted by their clearly different compositions. In this case, a Si-K and Si-Na phase have become immiscible and crystallised as separate phases to form the structures above.
Demo reflection…
In summary, this was an exciting opportunity to demonstrate exactly how our products can provide effective solutions for age old problems. Whether trying to deconvolute overlapping X-ray peaks, specify the age of Roman glass or investigate the evolving decorations of Victorian homes, a series of historic realisations can be made through the application of OI technology.
References
- Clarity and brilliance: antimony in colourless natron glass explored using Roman glass found in Britain | Archaeological and Anthropological Sciences (springer.com)